GBP/JPY Price Forecast: On a bearish correction, aiming for 202.40
The Pound dives below 203.00 after rejection at the 205.00 area.
A verbal intervention from Japan's Finance Minister Kato has given some support to the Yen.
GBP/JPY: A confirmation below 203.00 would increase pressure towards 202.40 and 202.15
The British Pound’s rally from last week’s lows at 197.40 area was capped earlier this week at the 205.00 level, and the pair is correcting lower on Friday, aiming for the support areas of 202.50 and 202.15.
The Japanese Finance Minister, Katsunobu Kato, has complained about rapid, one-sided moves for the second time, reminding that the authorities will thoroughly monitor excessive fluctuations in the foreign exchange markets. These comments are normally seen as a veiled threat of intervention and have triggered some Yen short covering.
Technical analysis: Below 203.00, the targets are 202.40 and 202.15
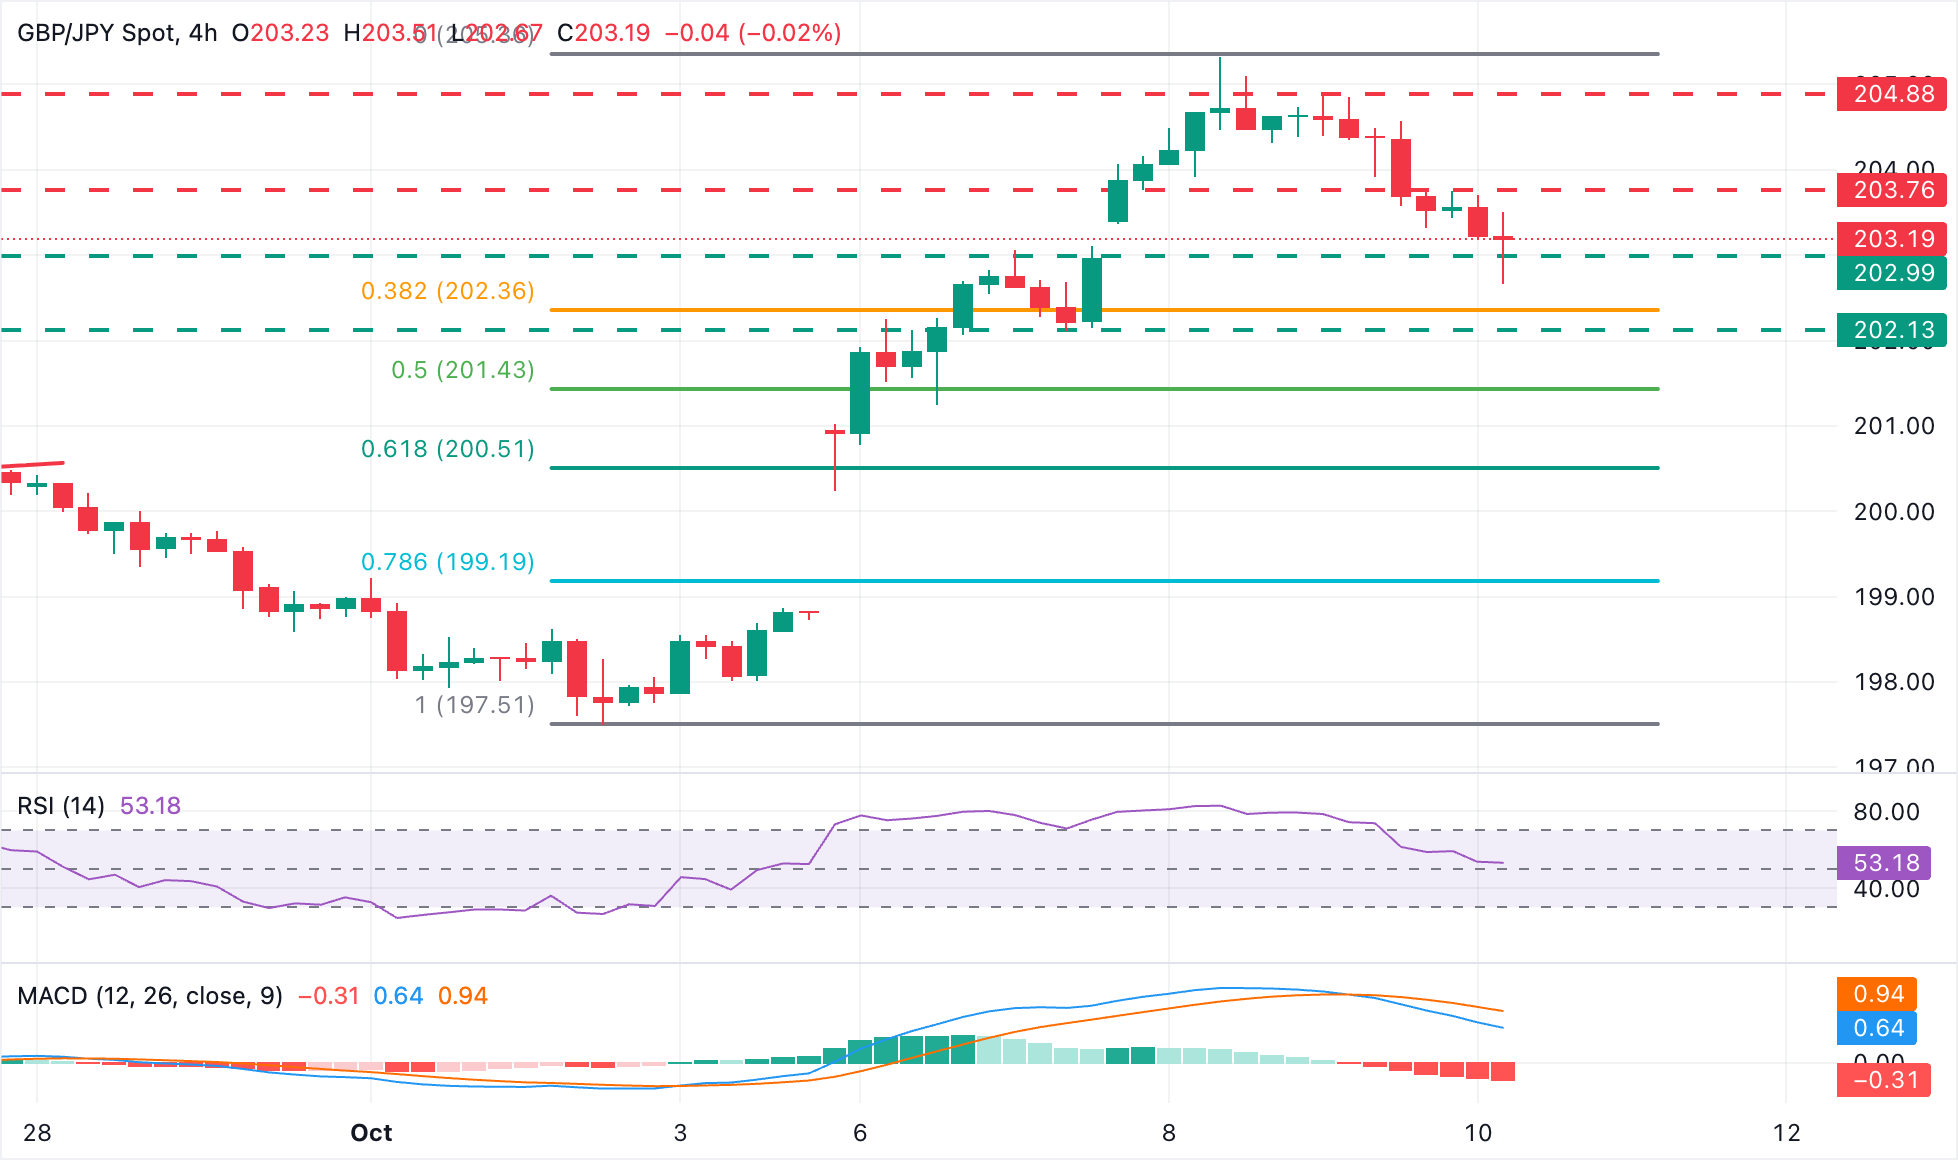
Intra-day technical indicators have turned lower after failure at the 205.00 area earlier this week. The 4-hour Relative Strength Index (RSI) is about to cross below the key 50 level, while the Moving Average Convergence Divergence (MACD) shows an increasing negative pressure.
Bears have pierced the support area at 203.00, aiming for the 38.2% Fibonacci retracement of the October 2 - 8 bullish run, at the 202.40 area and the October 7 low, near 202.15
To the upside, immediate resistance is at the 203.75 intra-day level. Further up, the October 9 and 8 highs, at 204.90 and 205.35 respectively, will come into focus.
Japanese Yen Price Today
The table below shows the percentage change of Japanese Yen (JPY) against listed major currencies today. Japanese Yen was the strongest against the New Zealand Dollar.
| USD | EUR | GBP | JPY | CAD | AUD | NZD | CHF | |
|---|---|---|---|---|---|---|---|---|
| USD | -0.04% | 0.09% | 0.02% | 0.03% | 0.08% | 0.26% | -0.16% | |
| EUR | 0.04% | 0.18% | -0.02% | 0.07% | 0.17% | 0.07% | -0.03% | |
| GBP | -0.09% | -0.18% | -0.12% | -0.14% | -0.02% | 0.12% | -0.25% | |
| JPY | -0.02% | 0.02% | 0.12% | 0.13% | 0.16% | 0.28% | -0.06% | |
| CAD | -0.03% | -0.07% | 0.14% | -0.13% | 0.00% | 0.21% | -0.11% | |
| AUD | -0.08% | -0.17% | 0.02% | -0.16% | -0.00% | 0.15% | -0.23% | |
| NZD | -0.26% | -0.07% | -0.12% | -0.28% | -0.21% | -0.15% | -0.38% | |
| CHF | 0.16% | 0.03% | 0.25% | 0.06% | 0.11% | 0.23% | 0.38% |
The heat map shows percentage changes of major currencies against each other. The base currency is picked from the left column, while the quote currency is picked from the top row. For example, if you pick the Japanese Yen from the left column and move along the horizontal line to the US Dollar, the percentage change displayed in the box will represent JPY (base)/USD (quote).