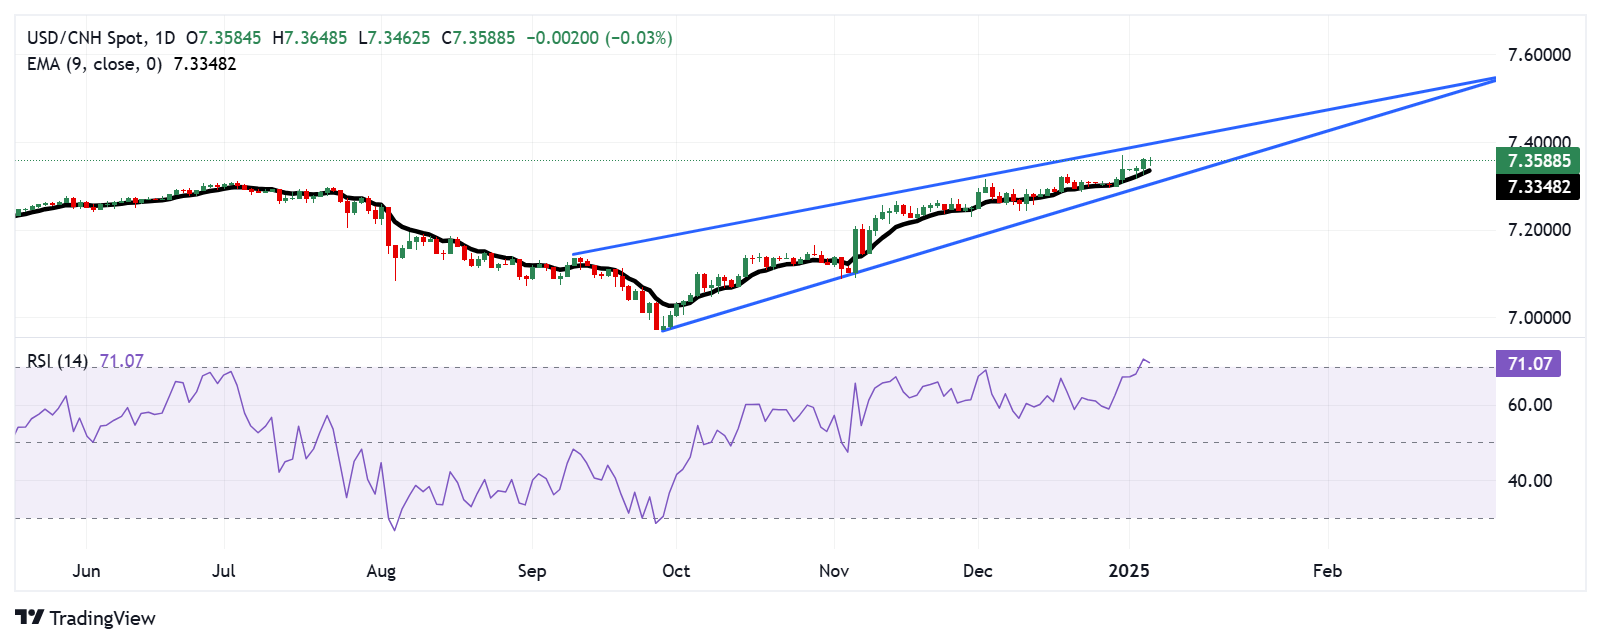
USD/CNH Price Analysis: Finds resistance near 7.3600 within an overbought territory
- USD/CNH may correct downwards as the 14-day RSI indicates an overbought condition.
- The primary barrier appears at the 7.3600, followed by the rising wedge’s upper slope around the 7.4000 level.
- The pair may test primary support at the nine-day EMA of 7.3346 level.
The USD/CNH pair halts its five-day winning streak, trading around 7.3570 during the Asian hours on Monday. A review of the daily chart suggests that the magnitude of price movement within the rising wedge pattern is decreasing, signaling a pause in the bullish trend.
The 14-day Relative Strength Index (RSI), a crucial momentum indicator, is positioned slightly above the 70 level, indicating an overbought condition and the possibility of a downward correction in the near term.
The USD/CNH pair could find primary resistance at the psychological level of 7.3600 level, followed by the upper slope of the rising wedge around the 7.4000 level. A break above the rising wedge could strengthen the bullish bias and support the pair to continue its rally toward the major level of 7.5000.
On the downside, the USD/CNH pair may initially test the nine-day Exponential Moving Average (EMA) at 7.3346 level, followed by the rising wedge’s lower slope around 7.3070, followed by the psychological level of 7.3000. A break below this level could weaken the bullish momentum and put downward pressure on the pair to approach the next psychological support round 7.2000 level.
USD/CNH: Daily Chart

