EUR/GBP Price Forecast: Sideways trading with key support at 0.8600 in focus
- The Euro is trading lower on Wednesday but remains trapped within the weekly range.
- Doubts about a Eurozone-US trade deal are weighing on the common currency.
- Technical indicators show sideways consolidation above 0.8600.
The Euro is trading with a moderate bearish bias on Wednesday, although still within the last few days’ range. The lack of progress on the trade talks with the US is weighing on the common currency, although the positive comments from European negotiators keep hopes of a trade deal alive.
The German Chancellor Friedrich Merz reiterated this morning that he is confident of reaching a deal with the US before the August 1 deadline, but US President Trump affirmed that he will send a tariff letter to the Eurozone this week.
Trade uncertainty is affecting the Euro more severely than the Pound, as the UK secured a deal, albeit a modest one, in June.
Technical Analysis: EUR/GBP might have hit a top at 0.8665
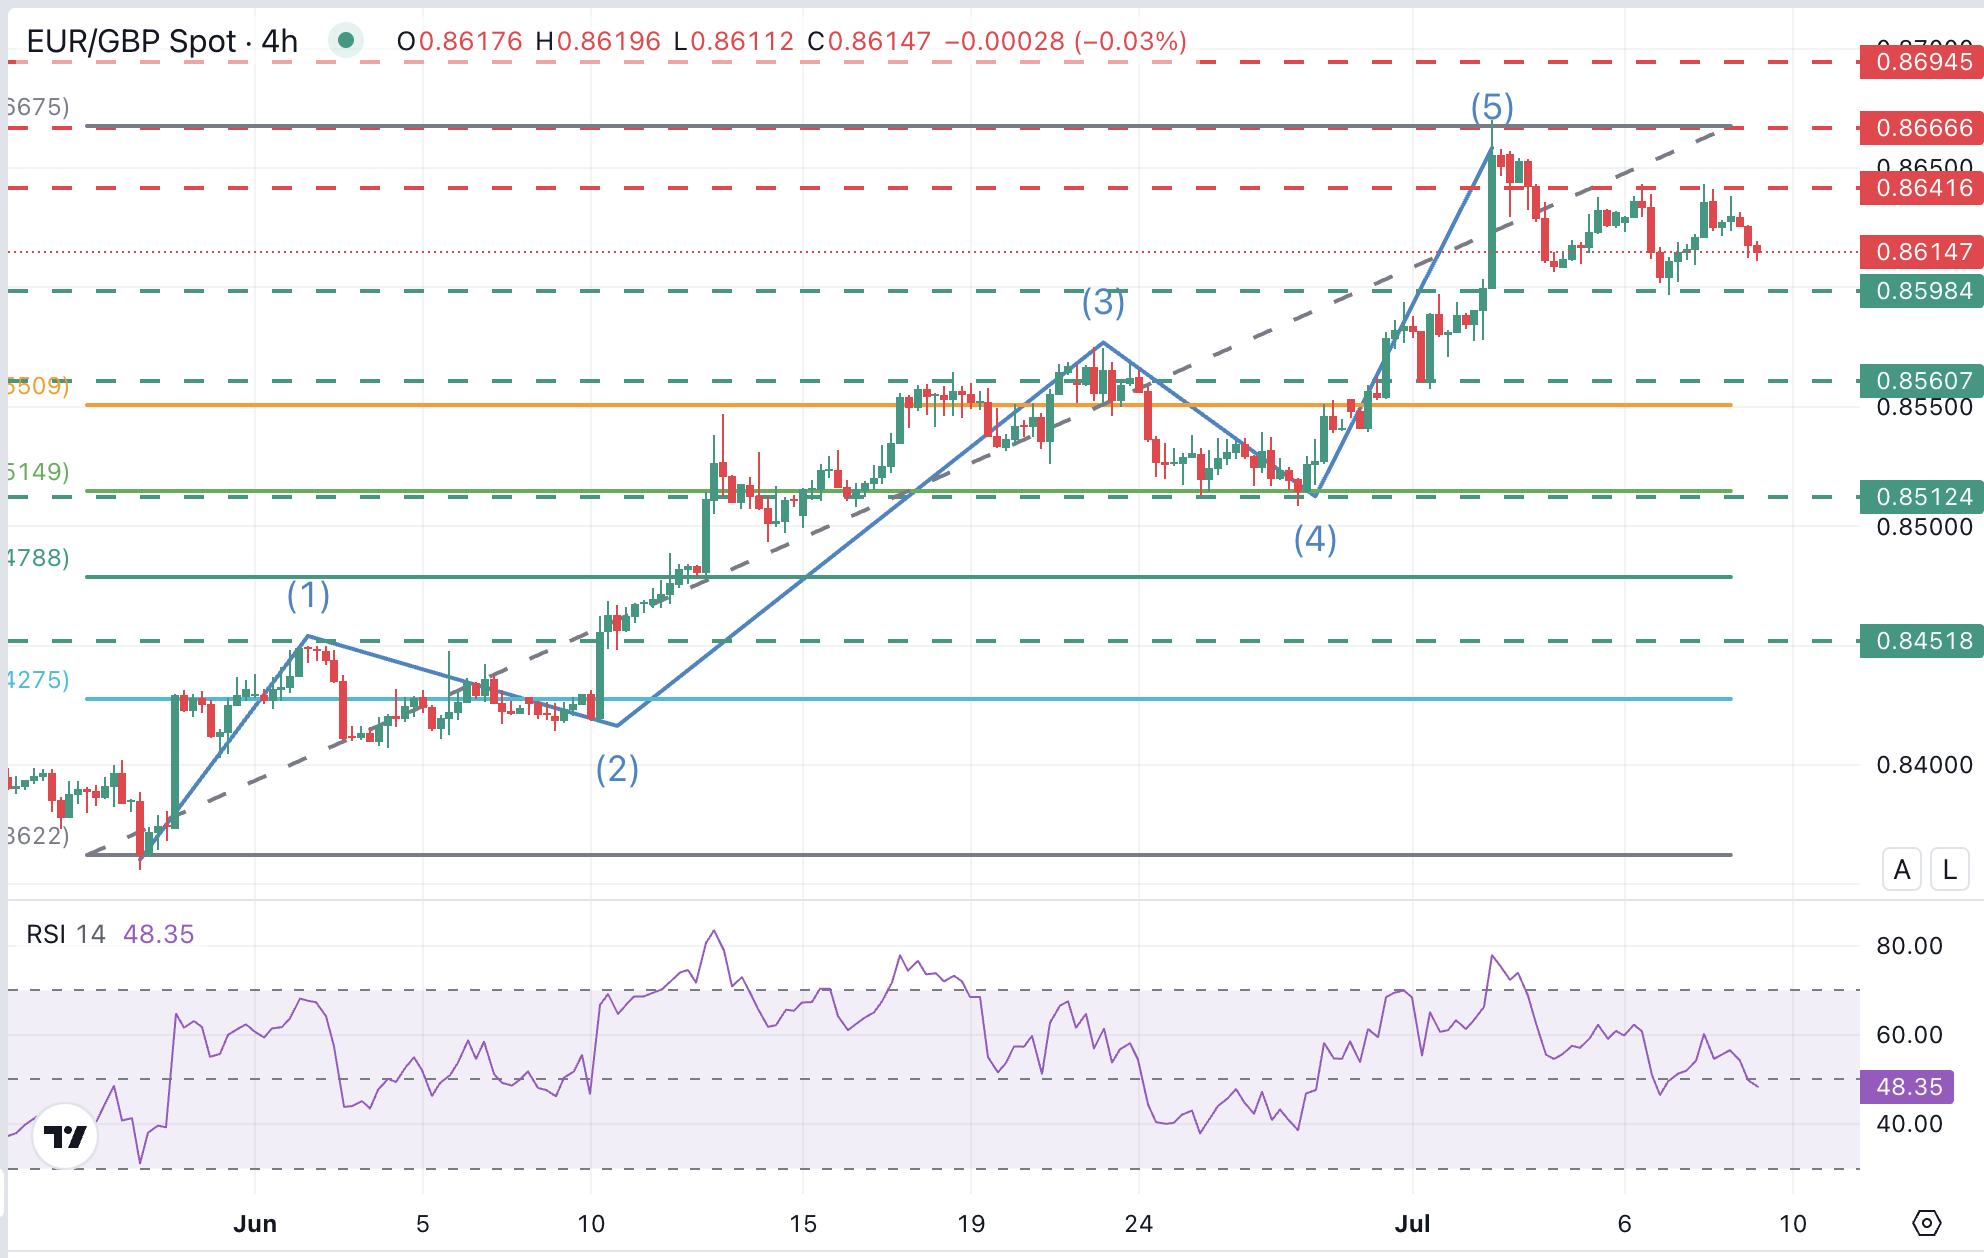
From a technical standpoint, a look at the four-hour chart shows a mixed picture, with the Relative Strength Index (RSI) fluctuating around 50, showing a lack of clear momentum. In a broaqder perspective, recent price action suggests that the pair completed a 5-Wave bullish cycle and is now in an A-B-C correction.
The pair, however, needs to break the 0.8600 level (July 7 low) to confirm this view and extend its correction to the 0.8550 - 0.8560 area, where the July 1 low meets the 38.2% Fibonacci retracement of the June-July rally, and a plausible technical floor for a bearish reversal.
On the upside, July 4 and 7 highs at the 0.8640 area are closing the path towards the July 2 high, at 0.8665. A confirmation above here cancels this view and shifts the focus to the year-to-date high, at 0.8740.
Euro PRICE Today
The table below shows the percentage change of Euro (EUR) against listed major currencies today. Euro was the strongest against the Canadian Dollar.
| USD | EUR | GBP | JPY | CAD | AUD | NZD | CHF | |
|---|---|---|---|---|---|---|---|---|
| USD | 0.18% | 0.03% | 0.06% | 0.28% | 0.08% | 0.14% | -0.03% | |
| EUR | -0.18% | -0.13% | -0.12% | 0.11% | -0.06% | -0.04% | -0.09% | |
| GBP | -0.03% | 0.13% | 0.06% | 0.25% | -0.00% | 0.04% | -0.05% | |
| JPY | -0.06% | 0.12% | -0.06% | 0.18% | 0.00% | 0.06% | -0.09% | |
| CAD | -0.28% | -0.11% | -0.25% | -0.18% | -0.14% | -0.13% | -0.18% | |
| AUD | -0.08% | 0.06% | 0.00% | -0.01% | 0.14% | 0.02% | -0.02% | |
| NZD | -0.14% | 0.04% | -0.04% | -0.06% | 0.13% | -0.02% | -0.08% | |
| CHF | 0.03% | 0.09% | 0.05% | 0.09% | 0.18% | 0.02% | 0.08% |
The heat map shows percentage changes of major currencies against each other. The base currency is picked from the left column, while the quote currency is picked from the top row. For example, if you pick the Euro from the left column and move along the horizontal line to the US Dollar, the percentage change displayed in the box will represent EUR (base)/USD (quote).