EUR/JPY Price Forecast: Reaches fresh all-time highs above 176.00
- EUR/JPY marked an all-time high of 176.24 on Monday.
- The 14-day Relative Strength Index advances toward 70, strengthening the bullish bias.
- The primary support lies at the nine-day EMA of 174.02.
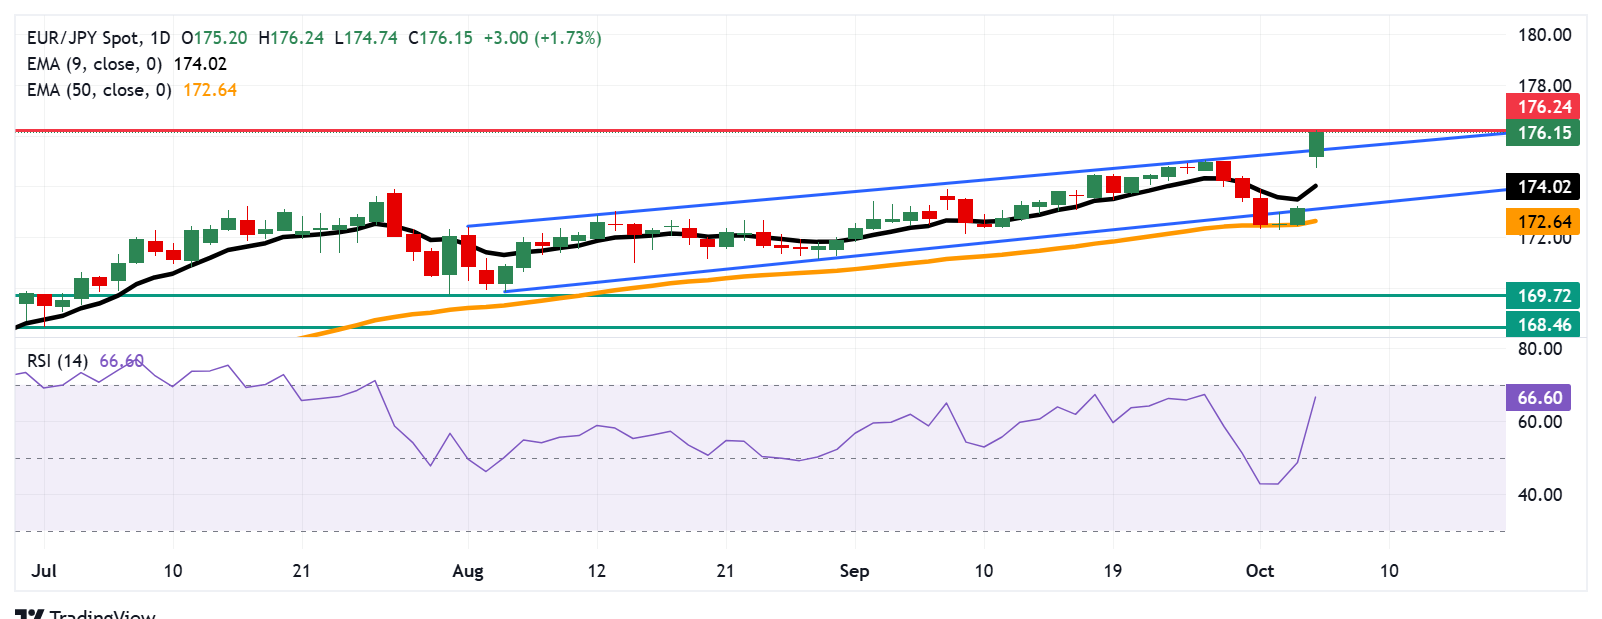
EUR/JPY opened at a gap-up, extending its gains and trading around 176.20 during the Asian hours on Monday. The technical analysis of the daily chart indicates strengthening of a bullish bias as the currency cross has broken above the ascending channel pattern.
Additionally, the 14-day Relative Strength Index (RSI) rises toward the 70 mark, suggesting that bearish bias is strengthening. A break above the 70 mark would suggest an overbought situation and a downward correction anytime soon. Additionally, the short-term price momentum is stronger as the EUR/JPY cross is positioned above the nine-day Exponential Moving Average (EMA).
On the upside, the EUR/JPY cross reached an all-time high of 176.24, which was recorded on October 6. As the market bias is bullish, the cross may explore the region around the psychological level of 177.00.
A pullback toward the ascending channel would prompt the EUR/JPY cross to test the nine-day EMA of 174.02. Further declines would weaken the short-term price momentum and put downward pressure on the currency cross to approach the lower boundary of the channel around 173.00, followed by the 50-day EMA at 172.64.
A break below the 50-day EMA would weaken the medium-term price momentum and put downward pressure on the EUR/JPY cross to navigate the region around the three-month low of 169.72, recorded on July 31.
EUR/JPY: Daily Chart
Euro Price Today
The table below shows the percentage change of Euro (EUR) against listed major currencies today. Euro was the strongest against the Japanese Yen.
| USD | EUR | GBP | JPY | CAD | AUD | NZD | CHF | |
|---|---|---|---|---|---|---|---|---|
| USD | 0.01% | -0.00% | 0.57% | -0.04% | -0.29% | -0.23% | -0.04% | |
| EUR | -0.01% | -0.12% | 0.48% | -0.09% | -0.34% | -0.28% | -0.09% | |
| GBP | 0.00% | 0.12% | 0.69% | 0.03% | -0.22% | -0.16% | 0.03% | |
| JPY | -0.57% | -0.48% | -0.69% | -0.56% | -0.91% | -0.87% | -0.66% | |
| CAD | 0.04% | 0.09% | -0.03% | 0.56% | -0.21% | -0.19% | -0.01% | |
| AUD | 0.29% | 0.34% | 0.22% | 0.91% | 0.21% | 0.07% | 0.25% | |
| NZD | 0.23% | 0.28% | 0.16% | 0.87% | 0.19% | -0.07% | 0.18% | |
| CHF | 0.04% | 0.09% | -0.03% | 0.66% | 0.01% | -0.25% | -0.18% |
The heat map shows percentage changes of major currencies against each other. The base currency is picked from the left column, while the quote currency is picked from the top row. For example, if you pick the Euro from the left column and move along the horizontal line to the US Dollar, the percentage change displayed in the box will represent EUR (base)/USD (quote).